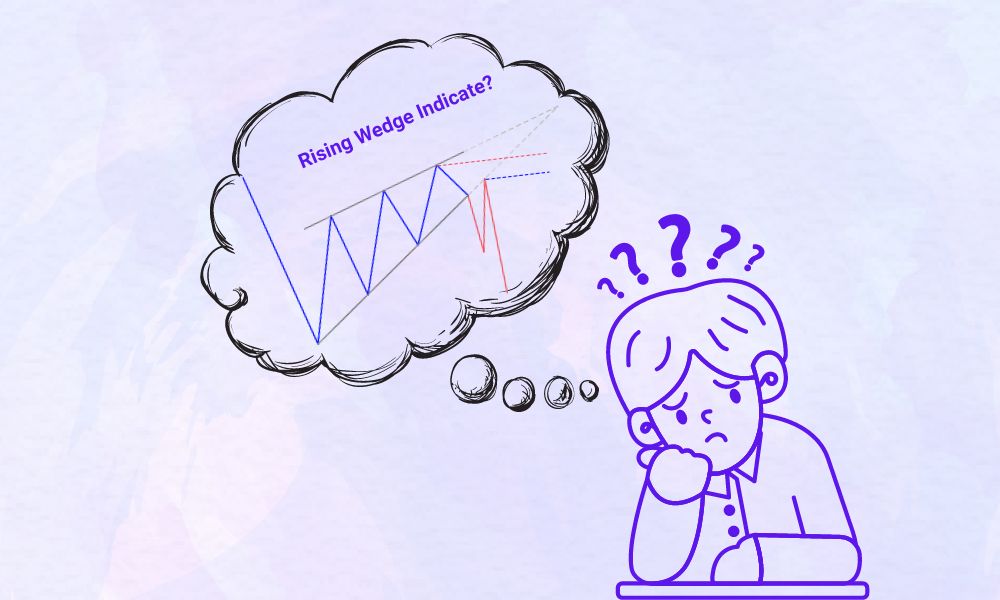
The rising wedge chart pattern is a negative chart pattern comprised of two trend lines that converge. The first trend line in the pattern connects the recent lower and higher highs, and the second trend line in the pattern connects the recent lows.
The outcome is a shape that resembles a triangle that is tilted in an upward direction. A falling wedge is a pattern that occurs in the opposite direction of a rising wedge.
The rising wedge pattern might be regarded as a bearish wedge due to the fact that the low has surpassed the high, and the lower trend line is steeper.
Although the falling wedges have a similar shape, the only things that set them apart are the angle at which the triangle is slanted and the consequence inferred by the pattern.
The rising wedge (ascending) pattern is a negative chart pattern since it predicts future falling prices or a breakout to a downtrend, and the trading volume drops as the wedge proceeds.
Even if the wedge is still capturing the price action and advancing higher, the decreasing trading volume may indicate that sellers are gathering their strength in preparation for a negative breakout.
The rising wedge pattern is typically noticed following extended trends. Therefore, it can be highly beneficial for trading cryptocurrencies.
For instance, if a crypto trend has advanced too quickly and far, the wedge pattern may indicate an imminent trend reversal.
An imbalance between buyers and sellers is the cause of significant trends. Buyers and sellers are trading at each price. If there is an imbalance where there are many buyers but no sellers, the price must rise to higher levels to attract more sellers.
If the price rise fails to attract additional vendors, prices will continue to fluctuate significantly. This swift adjustment generates sturdy uptrends that begin to entice other buyers who fear missing out on a solid trend.
After this strong trend has built and major crypto whales lose interest in purchasing, the price will begin to correct, attracting FOMO buyers. Each new high is followed by a correction, which attracts additional buyers.
The rising wedge pattern has formed at this time, and a significant market correction is imminent.
The ascending wedge, also known as the rising wedge, is a bearish reversal pattern. As a result, you can anticipate a market direction reversal after the pattern is complete.
As the increasing wedge pattern continues upward, a bearish reversal is imminent, reversing the upward trend to a downward one.
Contrary to a reversal pattern, a continuation pattern is an opposite. The manifestation of continuation patterns is an interruption of the overall trend. However, reversal patterns emerge after the conclusion of trends, after which the market turns course.
The similarity between a wedge pattern and a triangle pattern may confuse cryptocurrency traders. However, there are distinctions between the two that enables the trader to determine the market's future direction with greater precision.
Both wedge and triangle formations look like triangles because the trend lines of resistance and support meet in the middle of them.
The main difference is that wedges grow in the direction of the larger trend, either up or down, while triangles grow sideways or flat. In the preceding illustration of an ascending wedge, the resistance and support trend lines converge as they ascend.
Similarly, the resistance and support trend lines of the falling wedge converge as they decline. Still, the triangular pattern has resistance and support trend lines that converge.
Nevertheless, the resistance trend line is either horizontal or descending, and the support trend line is either rising or flat. Thus, wedges are reversal patterns, and the triangle is a continuation pattern.
In a valid pattern of an ascending wedge, you'll find the following:
Choppy waves and overlap
There were more highs and more lows.
A resistance trend line that goes up
A support trendline that goes up
When extrapolated, resistance and support trend lines that meet and cross
If you see a pattern with all these parts, you likely see an ascending wedge pattern.
You might also see a couple of other things, but these are just suggestions and not guarantees.
Rising wedges have a low risk and high reward ratio, which is why professional technical traders like them. There are a lot of false patterns or patterns that look like rising wedges but aren't what they seem to be.
The only way to tell a natural rising wedge from a fake one is to look for price/volume divergences and ensure that the failure is still below the 50% Fibonacci retracement.
This historical example shows that the next goal is usually reached very quickly when the breakdown happens.
|
HOT TOPICS |
|
-1666757035.jpg) |
|
 |
EUR/USD Weekly Forecast: Stop The Downturn, The Dollar Bulls Have Returned |
 |


