-1666757035.jpg)
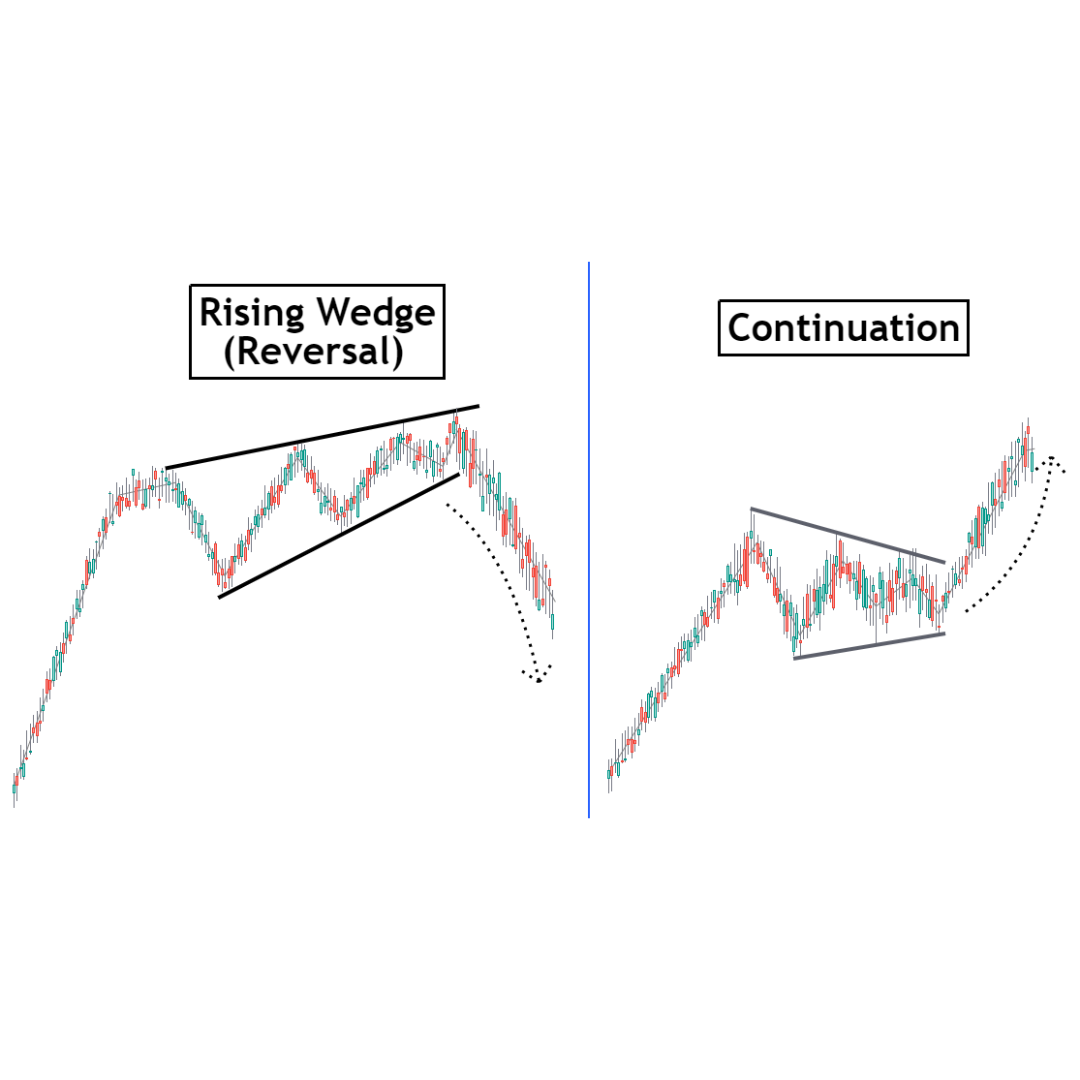
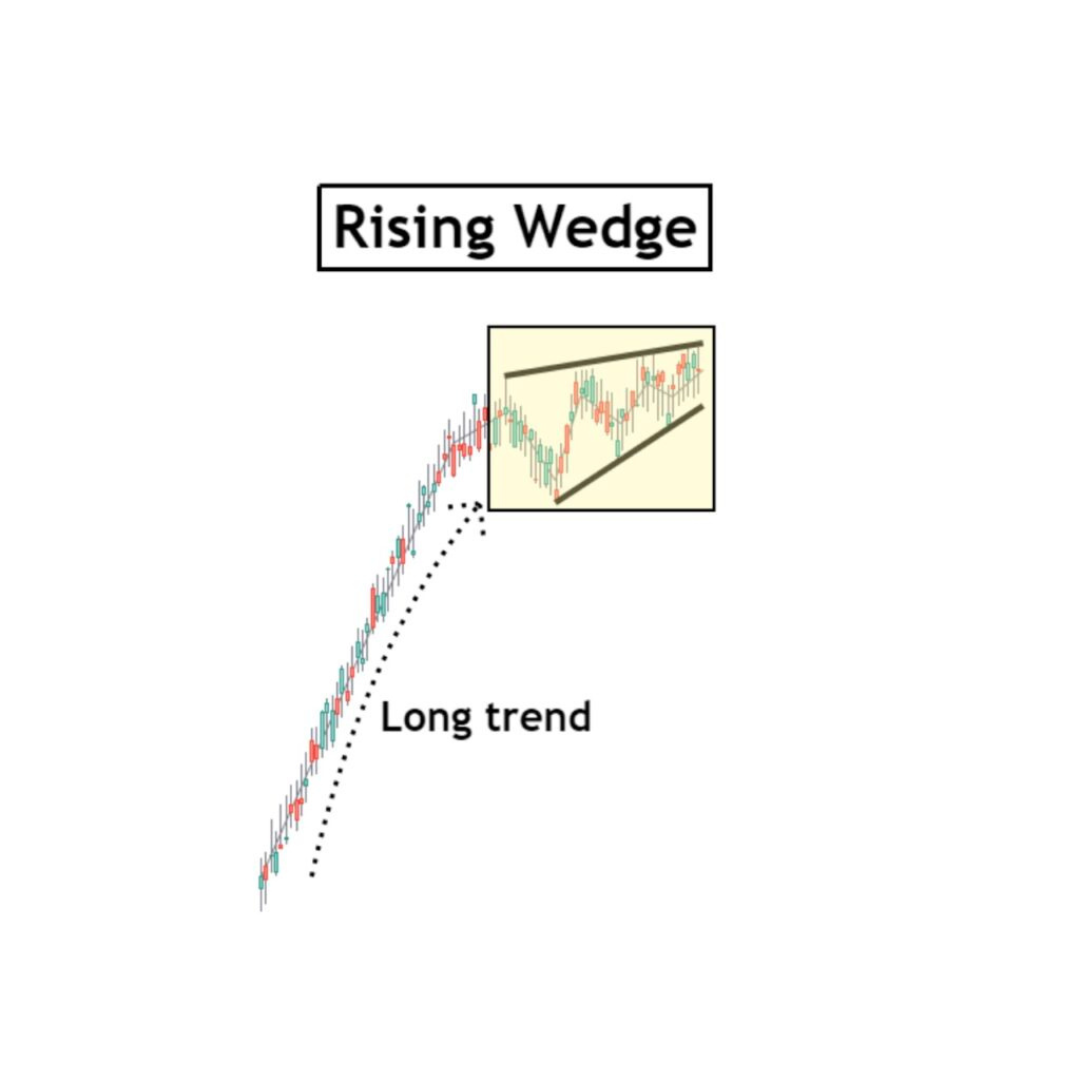
A rising wedge is a bearish chart pattern that consists of two converging trend lines, with the first line connecting recent lower highs and higher highs and the second line connecting recent lows.
The resulting shape resembles an upward-angled triangle. A falling wedge pattern is the inverse of a rising wedge.
The ascending wedge, also known as the rising wedge, is a bearish reversal pattern. This indicates that you should anticipate a market direction reversal after the pattern is complete.
As the rising wedge pattern continues upward, a bearish reversal is imminent, reversing the upward trend to a downward one.
Contrary to a reversal pattern, a continuation pattern is an opposite. The manifestation of continuation patterns is an interruption of the overall trend.
However, reversal patterns emerge after the conclusion of trends, after which the market turns course. Some resemblances between wedge and triangle patterns may confuse crypto traders.
However, there are distinctions between the two that enables the trader to determine the market's future direction with greater precision.
The resistance and support trend lines that contain wedge and triangle patterns converge to form their triangular shapes.
The primary distinction between wedges and triangles is that wedges form in the direction of the greater trend — either up or down — whereas triangles form sideways or horizontally.
In the preceding illustration of an ascending wedge, the resistance and support trend lines converge as they rise. Similarly, the resistance and support trend lines of the falling wedge converge as they decline.
Still, the triangle pattern has resistance and support trend lines that converge. Nevertheless, the resistance trend line is either horizontal or descending, and the support trend line is either rising or horizontal.
Therefore, wedges are reversal patterns, whereas triangles are continuation patterns.
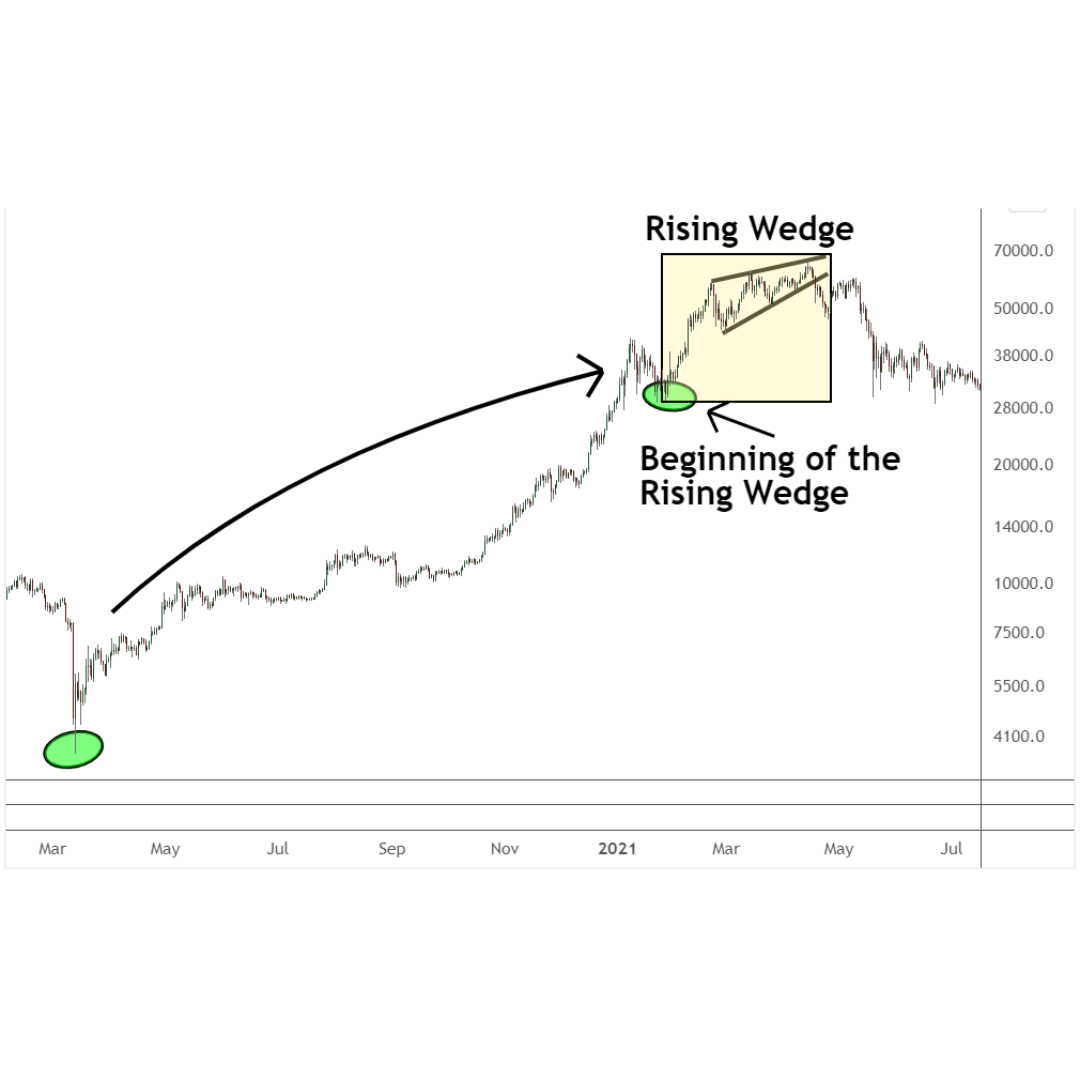
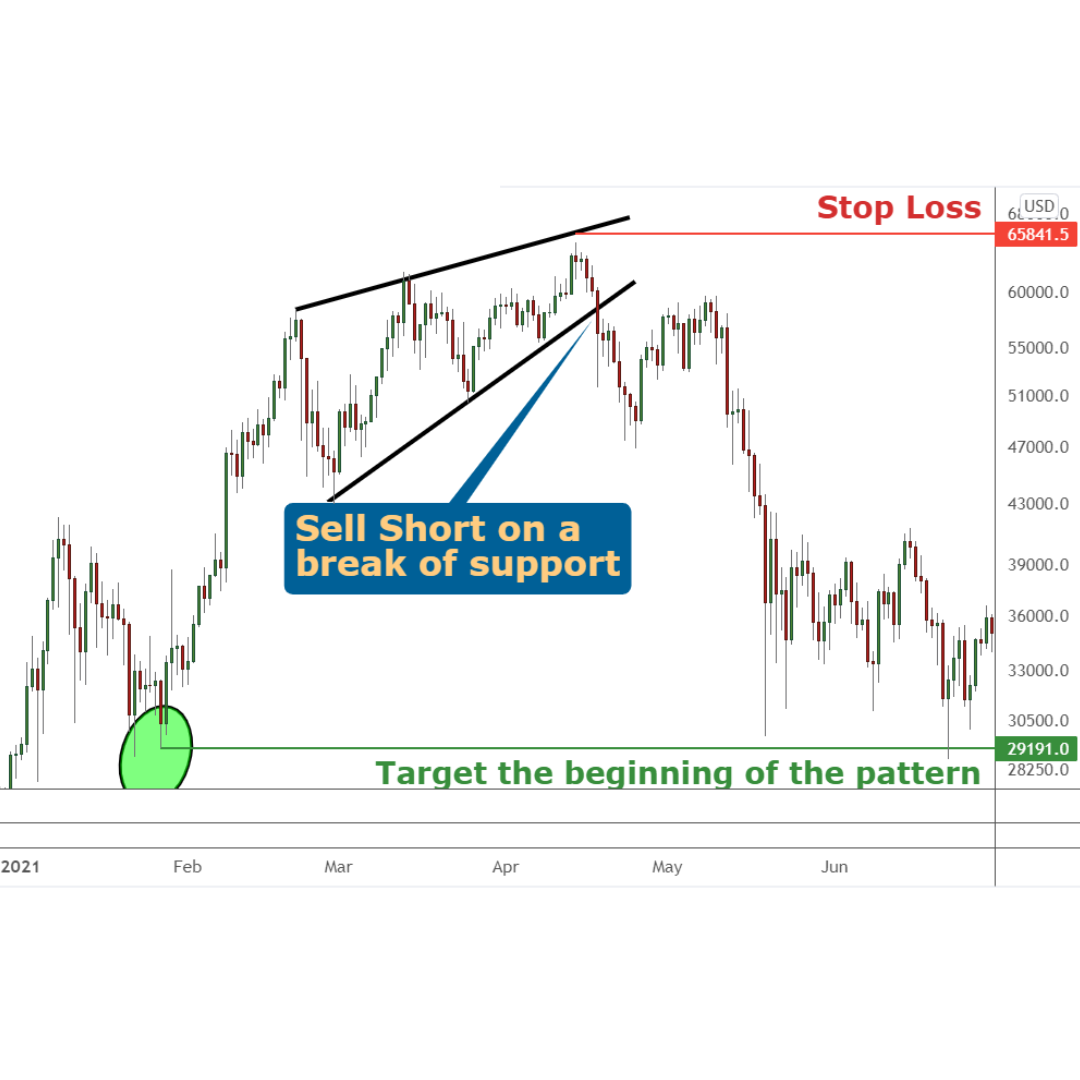
Bitcoin has developed one of the most visible and lucrative rising wedge patterns in crypto heading into April 2021. You may recall that Bitcoin was on a massive rise from the epidemic low in March 2020 to 2021 high.
During this era, it increased by over 1,600%, with bullish forecasts predicting immediate price increases.
The optimum period for the ascending wedge pattern is when optimistic market sentiment has traders anticipating skyrocketing price levels. Rising wedge patterns are known for arriving after very prolonged major rallies.
After completing most of the rise at the beginning of January 2021, Bitcoin began to correct for the remainder of the month. Beginning in late January, Bitcoin surged again, but this bounce is becoming choppy and inconsistent.
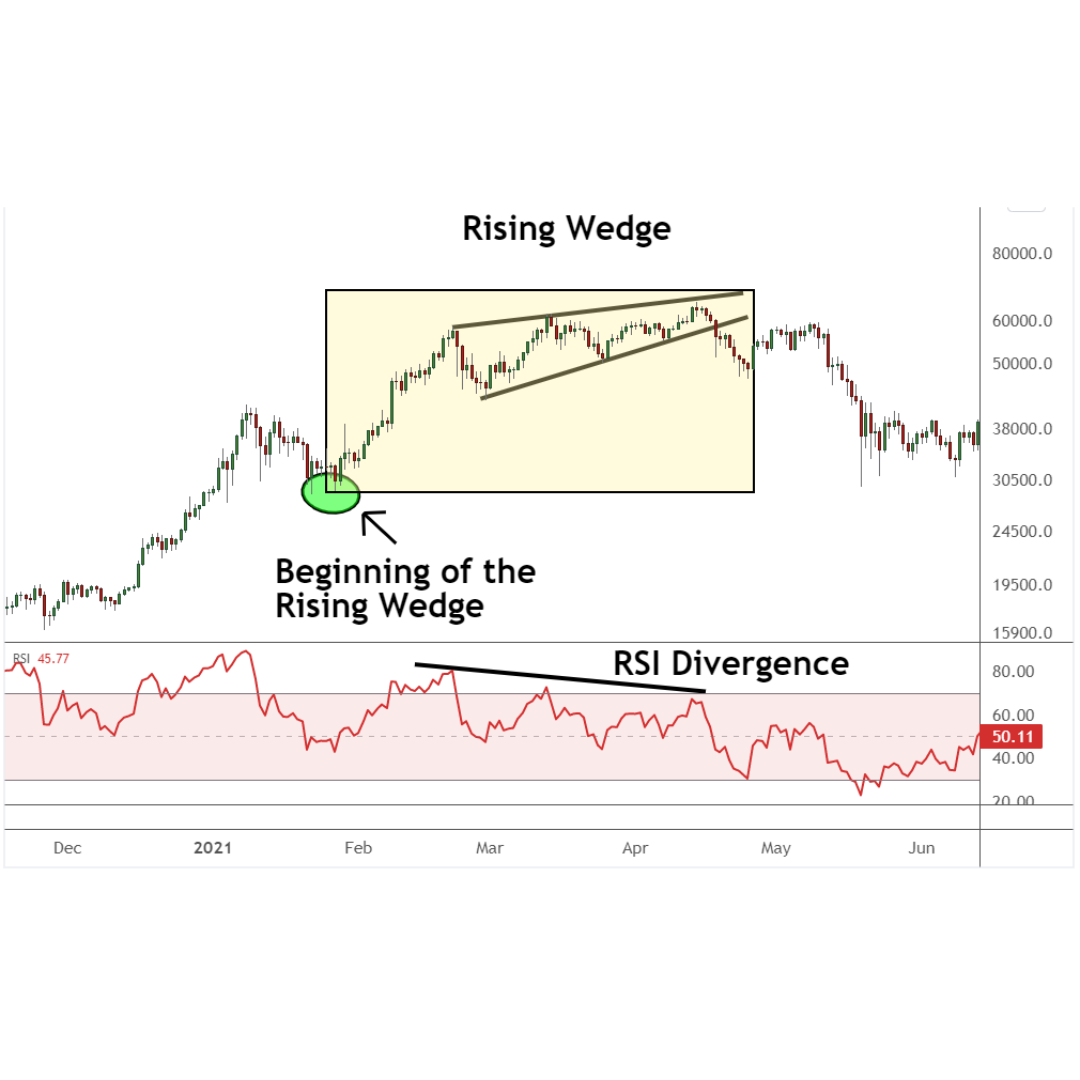
Rising wedge patterns are illustrated by divergence with the RSI indicator as the rally loses momentum. The pattern's resistance and support trend lines are ascending and converging, meeting the description.
Each indicator is present to tell the trader that a top is formed and that a negative reversal is imminent. Trading the bearish reversal is straightforward.
As the trend shifts from up to down, the optimal trading strategy is to short-sell the market or liquidate your long positions.
A breach of the support trend line will activate the short entry. Before joining the trade, some traders wait for the candle to break and close below the trend line.
Other traders sell short when the price falls below the trend line by a predetermined amount, such as 50 or 100 points.
Nonetheless, selling long is better once a predetermined level below support has been breached. Reason: crypto markets tend to collapse and crash rapidly. If you wait for the candle to expire, you may miss out on a more advantageous entry position.
Once support is breached, the market is sending a clear message: the upswing is beginning to transition into a decline.
The stop loss for a short trade will be positioned slightly above the latest swing high. If the market breaks the support trend line and rallies to new highs, a different pattern occurs, and the rising wedge pattern has failed.
Successful rising wedge patterns typically result in a market retracement to the formation's initial level. In this scenario, the pattern began at $29,250 on January 27, 2021. Consequently, a good rising wedge pattern will result in Bitcoin prices falling to $29,000.
In retrospect, it is evident that this pattern played out as expected: within one month of the signal confirmation (by mid-May), Bitcoin corrected back to the pattern's genesis.
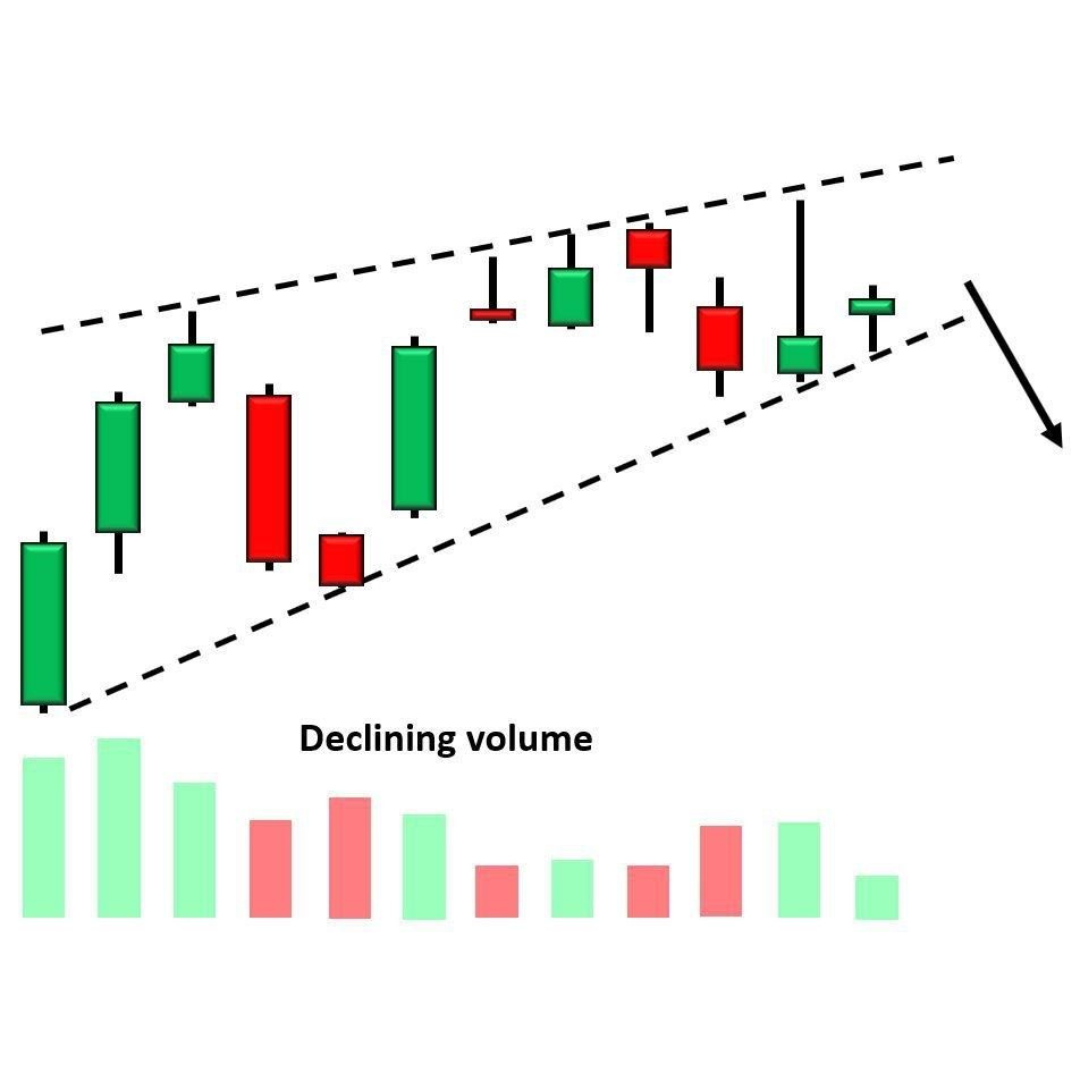
The rising wedge pattern resembles a slice of pizza and is created when two trend lines intersect. The rising wedge pattern is characterized by ascending highs and lows.
The resistance trend line must encompass the pattern's extreme high peaks. The resistance line must consist of a minimum of two higher peaks.
Similarly, a support trend line should be drawn above the higher lows. You'll need at least two swing low points to create the support trend line. After drawing the resistance and support trend lines, a triangular form, like a wedge, should be visible.
A crucial aspect of the rising wedge pattern is that the triangle's tip must point upward. Therefore, the resistance trend line must slope upward to confirm the rising wedge pattern.
The rising wedge pattern is typically noticed following extended trends. Therefore, it can be highly beneficial for trading cryptocurrencies.
For instance, if a crypto trend has advanced too quickly and far, the wedge pattern may indicate an imminent trend reversal.
An imbalance between buyers and sellers is the cause of significant trends. Buyers and sellers are trading at each price.
If there is an imbalance between buyers and sellers, the price must swiftly increase to higher levels to potentially entice more sellers to the market. If the increased price fails to attract other sellers, the price will continue to shift rapidly.
This rapid adjustment generates robust uptrends that begin to attract more buyers who fear missing out on a strong trend (known as FOMO, or fear of missing out).
After this strong trend has built and major crypto whales lose interest in purchasing, the price will begin to correct, attracting FOMO buyers. Each new high is followed by a correction, which attracts additional buyers.
The rising wedge pattern has formed at this time, and a significant market correction is imminent.
Patterns like a rising wedge are fairly prevalent among day traders and can be effective in any timeframe. The creation of these patterns on price charts has been regarded as a crucial indicator of an impending reversal.
In contrast to other patterns, however, rising wedges may exhibit suspicious behavior, making them challenging to analyze.
Therefore, traders wishing to employ rising wedge patterns to forecast future price moves should carefully evaluate the formation's length and context and use volume shifts and other technical indicators to validate the movements they appear to imply.
Importantly, they must implement a stop loss to protect against the effects of misleading signals and be prepared to alter their strategy rapidly in the event of changing market conditions.
|
HOT TOPICS |
|
 |
EUR/USD Weekly Forecast: Stop The Downturn, The Dollar Bulls Have Returned |
 |
|
 |
Brief Market Analysis For 2022 For Global Futures Trading Platforms |