When traders and analysts are observing the market, they are constantly analysing trends and patterns in an attempt to anticipate the next price movement.
Successful trading requires locating and correctly identifying patterns, as well as understanding their significance.
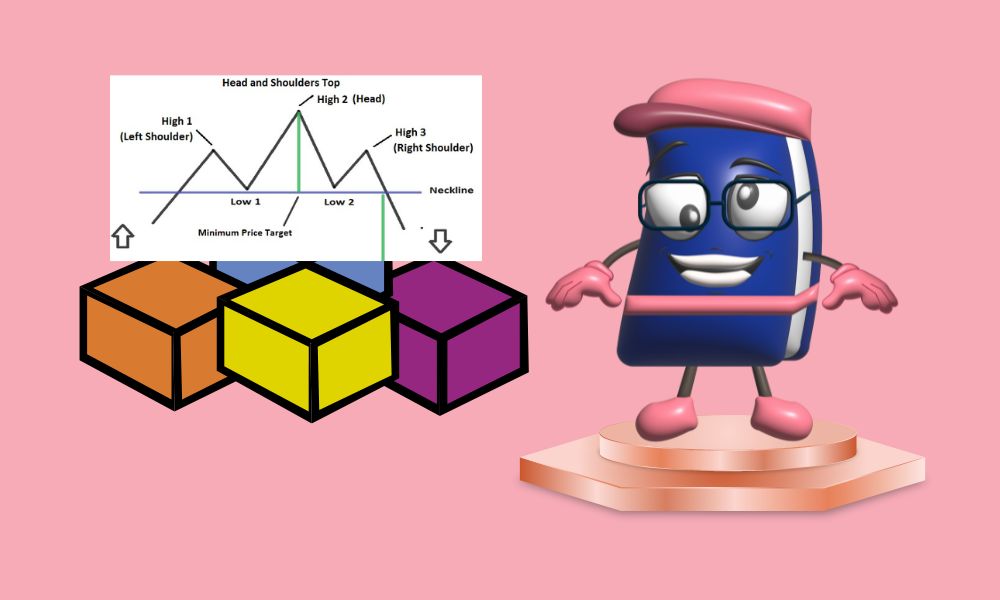
The head and shoulders pattern is significant because market analysts have historically relied on it. Below, we will explain the significance of this pattern and how you can profit from it.
The head and shoulders pattern is a chart formation in technical analysis that typically indicates a trend reversal in which the market shifts from bullish to bearish, or vice versa. This pattern has been recognized for a long time as a reliable indicator of trend reversal.
Before proceeding, it is essential to keep in mind that the head and shoulders pattern is almost never perfect, meaning that there will almost always be small price fluctuations between the shoulders and the head, and the pattern formation is rarely perfectly shaped.
Head and shoulders patterns can also form in the opposite direction, indicating a shift from a bearish to a bullish market trend.
This is known as an inverse head-and-shoulders pattern, which is simply the inverse of the pattern we just described, or an upside-down head-and-shoulders pattern.
The inverse pattern, therefore, indicates that the market is transitioning from a downward trend to an upward trend.
With the inverse head and shoulders pattern, stock prices will fall to three lows, separated by two temporary price rallies.
The middle valley, which represents the head of the inverse pattern, is the deepest, while the shoulders are slightly shallower.
Once the second shoulder has formed and broken above the neckline, prices will stage a final rally, indicating that the bearish trend has reversed and bulls are likely to assume control of the market.
The head and shoulders pattern is popular with traders due to its ability to assist them in estimating price targets once the pattern is complete and the neckline is crossed.
Traders can also place stop-loss orders with ease. Stops are typically placed above the head's peak high price when a head and shoulders pattern is present.
In an inverse head and shoulders pattern, stops are typically placed below the low price formed by the head. Returning to the pattern, measure the vertical distance from the top of the head to the neckline to estimate price movement after the neckline is broken.
After the second shoulder has formed, subtract the same distance in the opposite direction from the neckline, beginning at the point where prices first crossed the neckline.
For instance, if the distance between the neckline and the top of the head represents $20 in a stock's price, analysts would anticipate the stock to drop at least $20 below the neckline price level once the neckline is broken.
Despite the fact that this is only an estimate, many traders believe that prices will fall by at least this amount.
When dealing with a conventional head and shoulders pattern, you would measure the vertical distance from the top of the head to the neckline, allowing you to calculate the estimated amount of spread as previously discussed.
Obviously, the opposite holds true when examining an inverse pattern. Calculate the vertical distance from the top of the head to the neckline to estimate how much prices are likely to increase beyond the neckline.
Before making trades, it is essential to wait for a head and shoulders pattern to complete. If a pattern appears to be forming or is in the process of forming, you should not assume that it will fully develop and trade accordingly.
The market can be volatile and change rapidly, so keep an eye on emerging trends and exercise patience. Avoid overestimating your abilities.
Plan your trades in advance so that you are prepared to act as soon as the neckline is broken. Observe variables that may require you to modify your entry, stop, and profit targets.
There is an alternative entry point that traders frequently use, but it requires due diligence, patience, and swift action at the appropriate time.
Traders who take this alternative approach observe the pattern and wait for prices to retrace upward to or slightly above the broken neckline level.
This is a more conservative trade that allows traders to frequently enter at a lower price. However, there is a chance you will miss the trading opportunity entirely if you wait for a retracement that never occurs.
Lastly, it is essential to stick to trades that respect your risk tolerance and help you reach your trading goals. Historically, the head and shoulders pattern has proven to be relatively reliable in a notoriously unpredictable space.
It is also one of the easiest chart patterns to recognize. No chart pattern is 100% accurate, but when the head and shoulders pattern accurately predicts a major trend reversal, it represents a substantial opportunity for profit.


